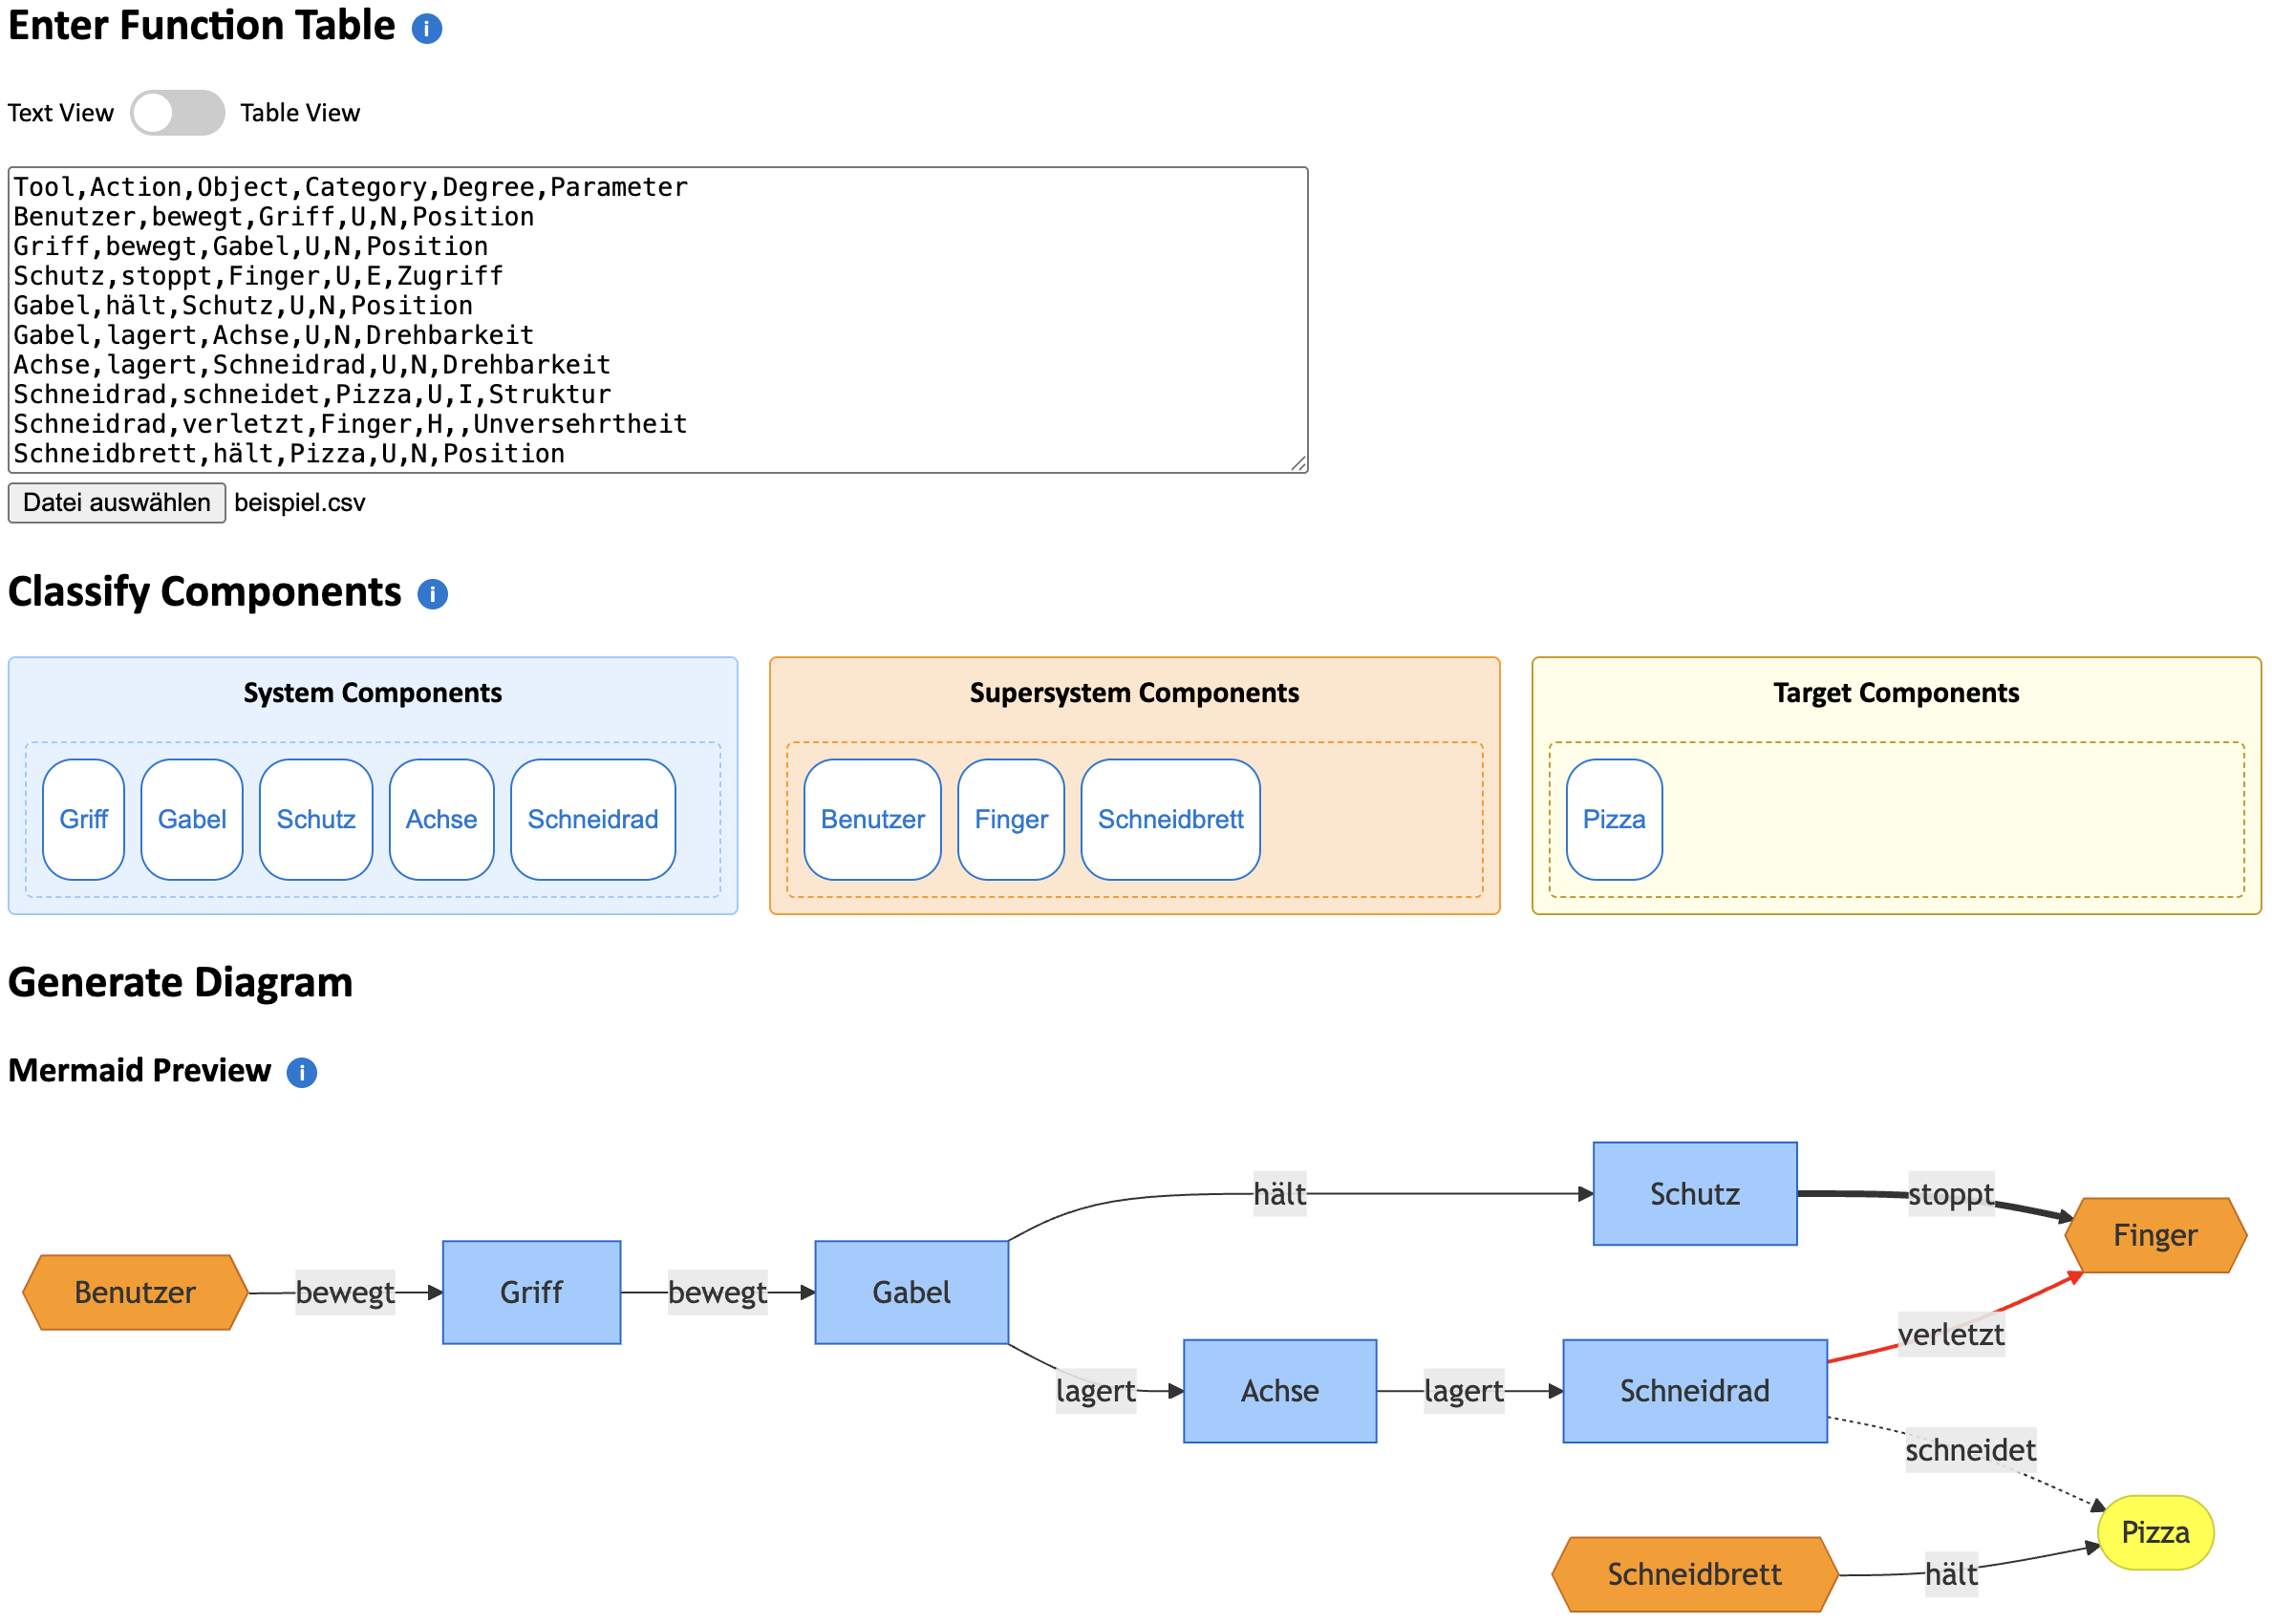
Visualizing a tabular Function Model (with AI)
For a long time, my workflow had an annoying break: I’d have AI generate a TRIZ-style tabular function model, then I still had to manually reconstruct it in yEd.
Two key inputs changed that:
@Jochen Wessner nudged me toward a simple but powerful idea: prompt the AI to output yEd-compatible .graphml directly.
Later, in Berlin at Siemens, system architects showed me Mermaid and the missing link clicked.
So I “vibe-coded” a small web tool that:
turns the CSV function table (from the function analysis prompts by @Tanasak and @Jens Träger) into a Mermaid diagram, and
exports the same model as yEd .graphml.
The best part: you can immediately spot when the AI has introduced a wrong relation, a missing operand, or a nonsense function, because the structure becomes visually obvious.
Try it:
Use the Function Analysis GPT (https://chatgpt.com/g/g-67d0261d0b688191a1ef221939e4c87e-triz-function-analysis) → generate the function table → export as .csv
Paste the full CSV into the text field on my page (https://www.triz-consulting.de/FunctionModel/index.html) → instant function model → export to .graphml if you want.
I’d love to see how you apply it! Please share your function graphics in the comments.